
Getting started
Projects and workspaces, the sidebar, the project overview, Data and what AcquiLAB asks before it runs anything.
Projects and workspaces
AcquiLAB is organised around a project. Files, analysis runs, optimization campaigns, simulations, figures, notebook entries and documents all belong to one project, and every project sits in a workspace: your personal workspace or a team workspace you were invited to. Members of a project see its work; a team workspace shares billing, runs and credits.
Everything keeps its provenance: which file and version, which method and method version, which settings, which model. Re-running, correcting or deleting something never silently changes a result someone already used; the places that use it say a newer version exists.
Your reference Library is the one thing that is personal rather than per project: it follows you across projects, and you link items to the projects that should see them.
The project overview
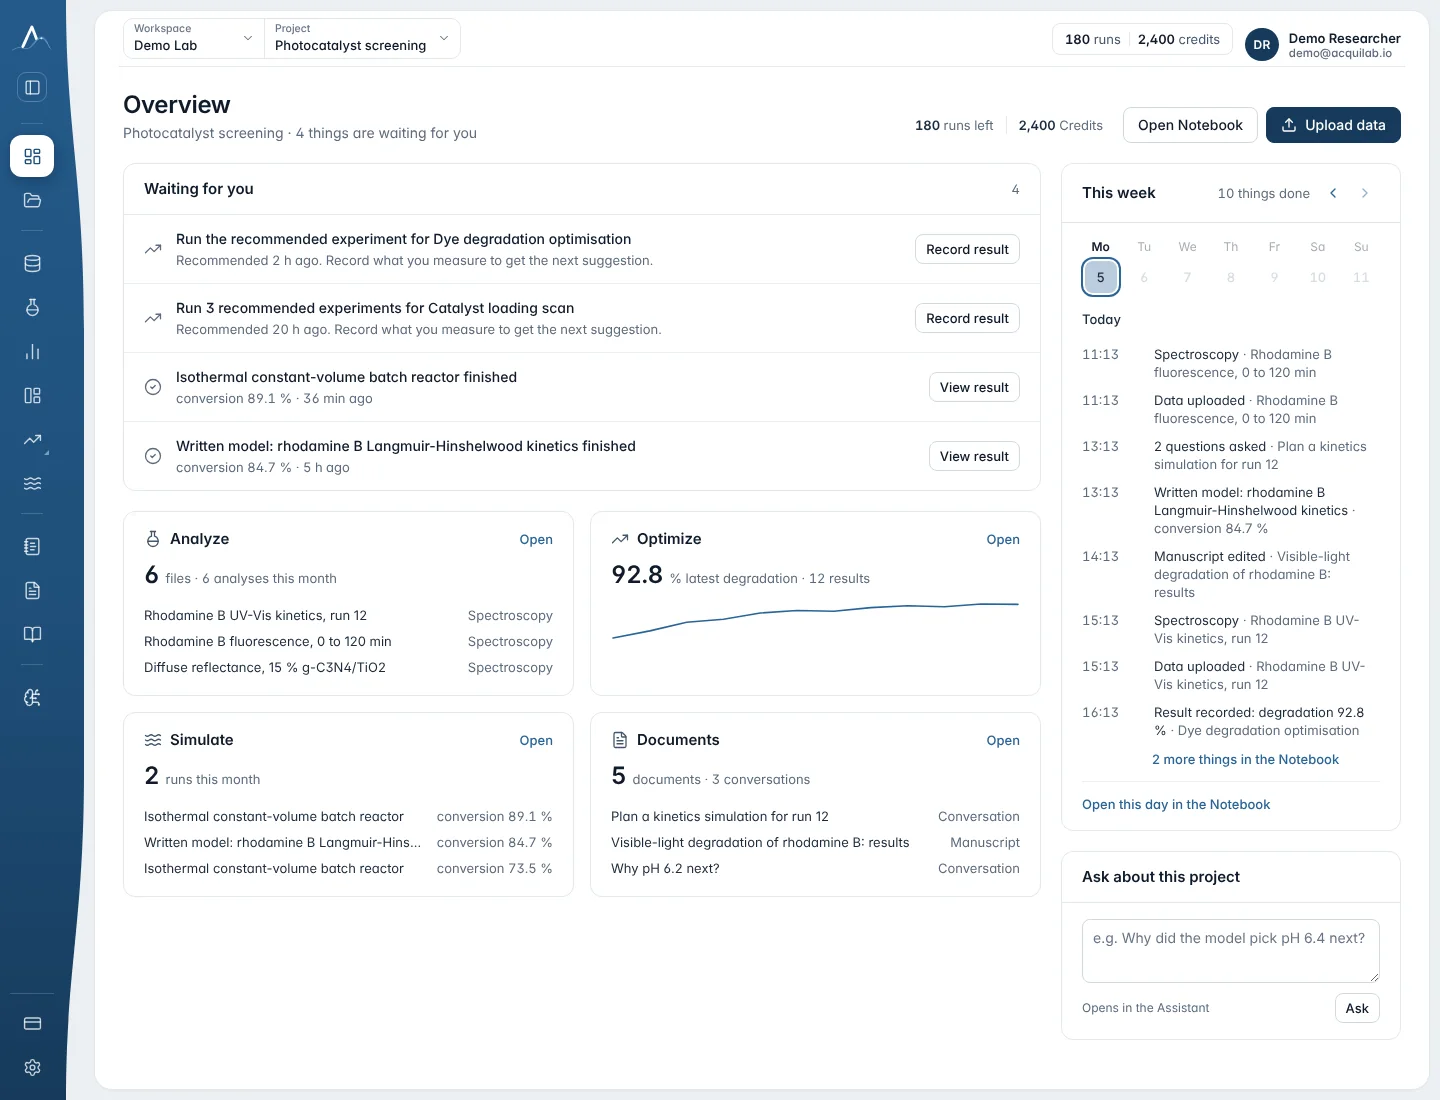
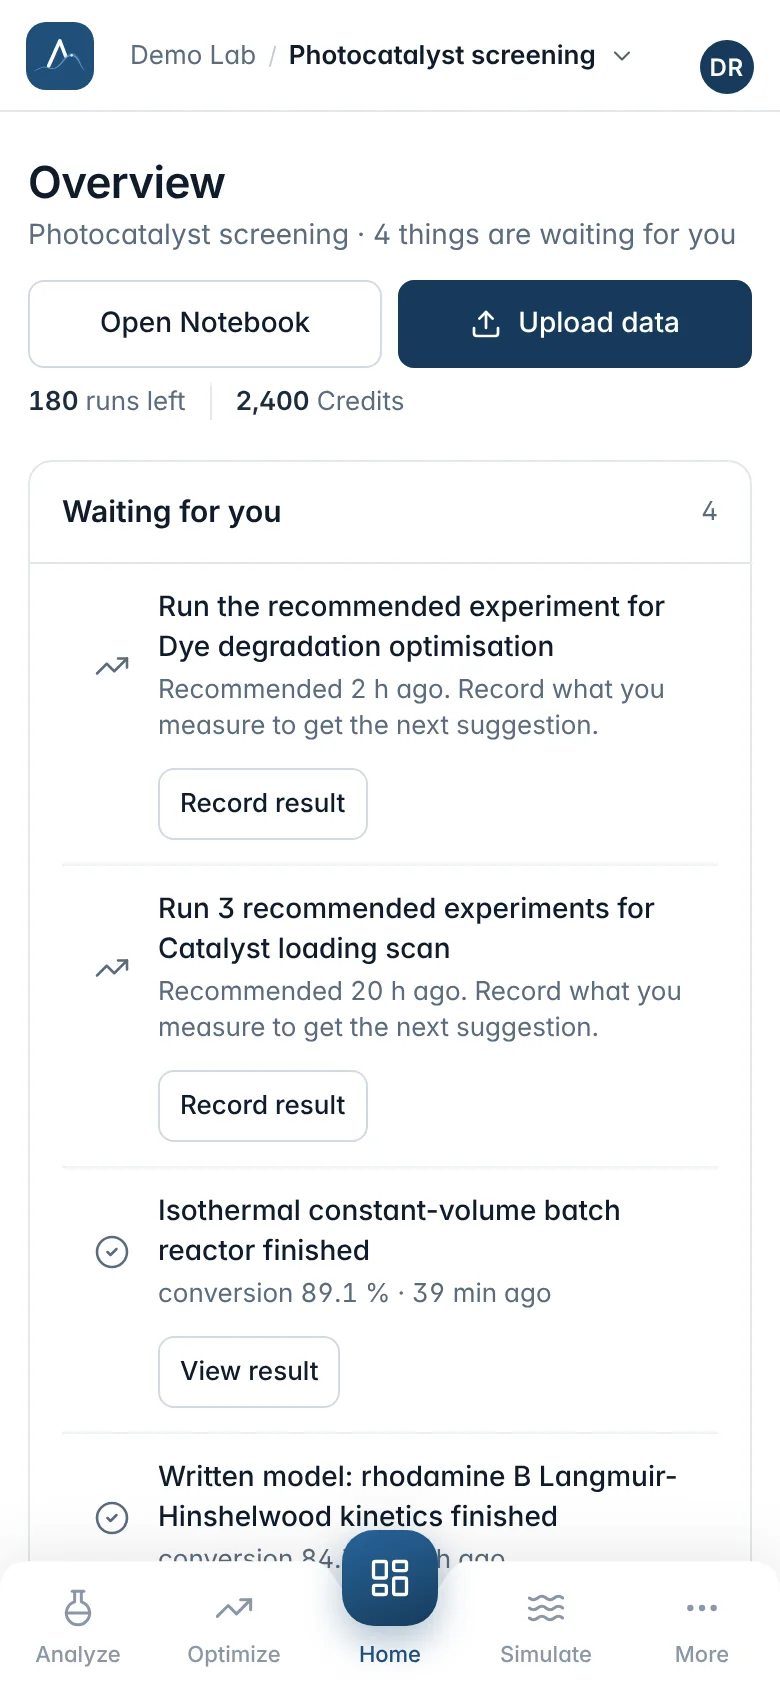
Home opens the overview of the current project. It answers three questions: what is waiting for me, what happened this week, and where do I continue.
Waiting for you
Recommended experiments to run, analyses or simulations that failed, and work that finished.
This week
Monday to Sunday, each day shaded by how much was done. Choose a day to list its work, or open that day in the Notebook.
Four panels
Analyze, Optimize, Simulate and Documents, each with the latest work and a button to start.
Ask about this project opens the Assistant with the project selected.
Data
Data lists everything the project holds, in three views.
| View | What it shows |
|---|---|
| Files | Uploaded and derived datasets with their versions and the runs made on them. Per file: Open result, Fix setup and re-run, New run, Open in Plot Studio, Upload new version, download the latest result (JSON) or a summary (CSV), and Delete file. |
| Simulation results | Simulation runs grouped as compared sets, optimization loops and consecutive runs of one model. Select runs to compare them, or Plot together. |
| Optimization results | Every campaign, single objective and multi-objective, with its objective, number of results and best so far, and Download results (CSV) with every recorded result (the Pareto front marked for multi-objective campaigns). |
Before anything runs
You start your own analyses and simulations with a button. When the Assistant or a connected AI agent wants to run something, it prepares it and waits for you:
- The Assistant shows a card with every setting and a Run now button. Nothing starts until you press it.
- Before any simulation, model fit or simulation optimization started by the Assistant or an agent, AcquiLAB asks for a plan: the mechanism and every constant with its source, the budget and the open questions. You answer the questions, and only then can runs start, within the plan's number of starts and for 24 hours. See Plan first.
- Work that uses runs or credits says so before it starts.
Your first hour
- Sign in and open Projects. Create a project (or use the one you were invited to) and select it in the top bar.
- Open Analyze, choose a technique, upload an instrument file and press Analyze. Plot Studio opens with the result. (Analyze)
- Style the graph and export it, or place it in a figure. (Plot Studio and Figure Studio)
- Open Optimize and create a campaign for something you are tuning in the lab: the result you measure and the settings you can change. Record what you already know, then ask for the next experiment. (Optimize)
- Ask the Assistant a question about the project, such as “Compare ΔEp across cycles in the CV I uploaded.” (Assistant)
- At the end of the week, open the Notebook and make the weekly update into a document. (Notebook and Documents)